Sharker
2016 Toyota Tacoma. Property of Frontier. Added Sep 4 2017
2017
|
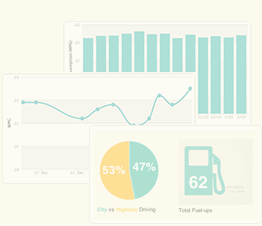
Total Fuel-ups
12
|
Avg Miles/Fuel-Up
336.5
|
Avg Price/Gallons
$2.38
|
|
Total Miles Tracked
3,701
|
Total Gallons Fueled
194.08
|
Avg Price/Fuel-up
$41.24
|
|
Total Spent
$494.90
|
Avg Price/Mile
$0.13
|
Avg MPG
19.1
|
2018
|
Total Fuel-ups
49
|
Avg Miles/Fuel-Up
310.4
|
Avg Price/Gallons
$2.53
|
|
Total Miles Tracked
15,210
|
Total Gallons Fueled
799.89
|
Avg Price/Fuel-up
$37.43
|
|
Total Spent
$2,021.11
|
Avg Price/Mile
$0.13
|
Avg MPG
19.0
|
2019
|
Total Fuel-ups
50
|
Avg Miles/Fuel-Up
334.1
|
Avg Price/Gallons
$2.43
|
|
Total Miles Tracked
16,706
|
Total Gallons Fueled
895.79
|
Avg Price/Fuel-up
$40.28
|
|
Total Spent
$2,175.35
|
Avg Price/Mile
$0.13
|
Avg MPG
18.6
|
2020
|
Total Fuel-ups
46
|
Avg Miles/Fuel-Up
320.3
|
Avg Price/Gallons
$2.00
|
|
Total Miles Tracked
14,732
|
Total Gallons Fueled
774.31
|
Avg Price/Fuel-up
$31.70
|
|
Total Spent
$1,553.26
|
Avg Price/Mile
$0.11
|
Avg MPG
19.0
|
2021
|
Total Fuel-ups
48
|
Avg Miles/Fuel-Up
331.6
|
Avg Price/Gallons
$2.84
|
|
Total Miles Tracked
15,918
|
Total Gallons Fueled
827.78
|
Avg Price/Fuel-up
$43.73
|
|
Total Spent
$2,361.36
|
Avg Price/Mile
$0.15
|
Avg MPG
19.2
|
2022
|
Total Fuel-ups
39
|
Avg Miles/Fuel-Up
315.5
|
Avg Price/Gallons
$3.65
|
|
Total Miles Tracked
12,305
|
Total Gallons Fueled
654.68
|
Avg Price/Fuel-up
$56.86
|
|
Total Spent
$2,388.14
|
Avg Price/Mile
$0.19
|
Avg MPG
18.8
|