BEASTMODE
2017 Toyota Sequoia. Property of natenation. Added Sep 7 2017
2017
|
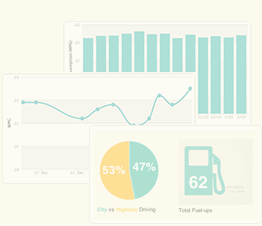
Total Fuel-ups
19
|
Avg Miles/Fuel-Up
171.2
|
Avg Price/Gallons
$2.47
|
|
Total Miles Tracked
2,910
|
Total Gallons Fueled
241.77
|
Avg Price/Fuel-up
$34.46
|
|
Total Spent
$654.72
|
Avg Price/Mile
$0.20
|
Avg MPG
12.0
|
2018
|
Total Fuel-ups
59
|
Avg Miles/Fuel-Up
169.3
|
Avg Price/Gallons
$2.64
|
|
Total Miles Tracked
9,309
|
Total Gallons Fueled
768.32
|
Avg Price/Fuel-up
$36.60
|
|
Total Spent
$2,159.17
|
Avg Price/Mile
$0.22
|
Avg MPG
12.1
|
2019
|
Total Fuel-ups
72
|
Avg Miles/Fuel-Up
186.5
|
Avg Price/Gallons
$2.66
|
|
Total Miles Tracked
13,425
|
Total Gallons Fueled
1,083.95
|
Avg Price/Fuel-up
$40.12
|
|
Total Spent
$2,888.50
|
Avg Price/Mile
$0.22
|
Avg MPG
12.4
|
2020
|
Total Fuel-ups
65
|
Avg Miles/Fuel-Up
201.2
|
Avg Price/Gallons
$2.25
|
|
Total Miles Tracked
12,673
|
Total Gallons Fueled
930.86
|
Avg Price/Fuel-up
$29.69
|
|
Total Spent
$1,930.15
|
Avg Price/Mile
$0.15
|
Avg MPG
13.6
|
2021
|
Total Fuel-ups
92
|
Avg Miles/Fuel-Up
190.7
|
Avg Price/Gallons
$2.98
|
|
Total Miles Tracked
17,356
|
Total Gallons Fueled
1,275.75
|
Avg Price/Fuel-up
$40.13
|
|
Total Spent
$3,691.88
|
Avg Price/Mile
$0.21
|
Avg MPG
13.6
|
2022
|
Total Fuel-ups
92
|
Avg Miles/Fuel-Up
184.0
|
Avg Price/Gallons
$3.77
|
|
Total Miles Tracked
16,924
|
Total Gallons Fueled
1,266.73
|
Avg Price/Fuel-up
$51.87
|
|
Total Spent
$4,772.31
|
Avg Price/Mile
$0.28
|
Avg MPG
13.4
|
2023
|
Total Fuel-ups
89
|
Avg Miles/Fuel-Up
186.4
|
Avg Price/Gallons
$3.40
|
|
Total Miles Tracked
16,220
|
Total Gallons Fueled
1,237.74
|
Avg Price/Fuel-up
$48.53
|
|
Total Spent
$4,318.81
|
Avg Price/Mile
$0.26
|
Avg MPG
13.1
|
2024
|
Total Fuel-ups
32
|
Avg Miles/Fuel-Up
185.0
|
Avg Price/Gallons
$3.09
|
|
Total Miles Tracked
5,919
|
Total Gallons Fueled
452.72
|
Avg Price/Fuel-up
$43.61
|
|
Total Spent
$1,395.57
|
Avg Price/Mile
$0.24
|
Avg MPG
13.1
|