Orion Nebula
2018 Toyota Camry. Property of SuzelBug. Added Feb 17 2018
2018
|
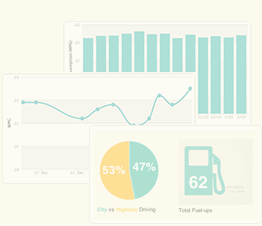
Total Fuel-ups
50
|
Avg Miles/Fuel-Up
398.7
|
Avg Price/Gallons
$2.70
|
|
Total Miles Tracked
19,536
|
Total Gallons Fueled
552.70
|
Avg Price/Fuel-up
$30.39
|
|
Total Spent
$1,519.56
|
Avg Price/Mile
$0.08
|
Avg MPG
35.3
|
2019
|
Total Fuel-ups
52
|
Avg Miles/Fuel-Up
389.8
|
Avg Price/Gallons
$2.60
|
|
Total Miles Tracked
20,268
|
Total Gallons Fueled
579.92
|
Avg Price/Fuel-up
$29.09
|
|
Total Spent
$1,512.70
|
Avg Price/Mile
$0.07
|
Avg MPG
34.9
|
2020
|
Total Fuel-ups
28
|
Avg Miles/Fuel-Up
341.2
|
Avg Price/Gallons
$2.19
|
|
Total Miles Tracked
9,555
|
Total Gallons Fueled
280.37
|
Avg Price/Fuel-up
$22.14
|
|
Total Spent
$619.86
|
Avg Price/Mile
$0.06
|
Avg MPG
34.1
|
2021
|
Total Fuel-ups
38
|
Avg Miles/Fuel-Up
369.3
|
Avg Price/Gallons
$3.08
|
|
Total Miles Tracked
14,035
|
Total Gallons Fueled
405.84
|
Avg Price/Fuel-up
$32.73
|
|
Total Spent
$1,243.75
|
Avg Price/Mile
$0.09
|
Avg MPG
34.6
|
2022
|
Total Fuel-ups
50
|
Avg Miles/Fuel-Up
372.4
|
Avg Price/Gallons
$4.05
|
|
Total Miles Tracked
18,620
|
Total Gallons Fueled
545.90
|
Avg Price/Fuel-up
$44.05
|
|
Total Spent
$2,202.32
|
Avg Price/Mile
$0.12
|
Avg MPG
34.1
|
2023
|
Total Fuel-ups
60
|
Avg Miles/Fuel-Up
383.1
|
Avg Price/Gallons
$3.57
|
|
Total Miles Tracked
22,985
|
Total Gallons Fueled
657.71
|
Avg Price/Fuel-up
$39.12
|
|
Total Spent
$2,347.07
|
Avg Price/Mile
$0.10
|
Avg MPG
34.9
|
2024
|
Total Fuel-ups
14
|
Avg Miles/Fuel-Up
336.6
|
Avg Price/Gallons
$3.24
|
|
Total Miles Tracked
4,712
|
Total Gallons Fueled
140.38
|
Avg Price/Fuel-up
$32.35
|
|
Total Spent
$452.94
|
Avg Price/Mile
$0.10
|
Avg MPG
33.6
|