Chuggin
2013 Subaru Outback. Property of Snaps. Added Feb 28 2014
2014
|
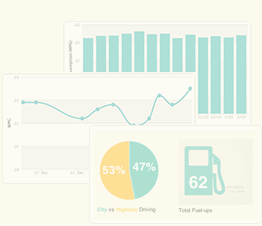
Total Fuel-ups
63
|
Avg Miles/Fuel-Up
340.9
|
Avg Price/Gallons
$3.15
|
|
Total Miles Tracked
20,792
|
Total Gallons Fueled
858.85
|
Avg Price/Fuel-up
$44.28
|
|
Total Spent
$2,789.52
|
Avg Price/Mile
$0.13
|
Avg MPG
24.2
|
2015
|
Total Fuel-ups
37
|
Avg Miles/Fuel-Up
340.0
|
Avg Price/Gallons
$1.99
|
|
Total Miles Tracked
11,219
|
Total Gallons Fueled
518.70
|
Avg Price/Fuel-up
$31.38
|
|
Total Spent
$1,160.92
|
Avg Price/Mile
$0.09
|
Avg MPG
21.6
|
2016
|
Total Fuel-ups
55
|
Avg Miles/Fuel-Up
317.4
|
Avg Price/Gallons
$1.88
|
|
Total Miles Tracked
17,140
|
Total Gallons Fueled
829.29
|
Avg Price/Fuel-up
$28.90
|
|
Total Spent
$1,589.68
|
Avg Price/Mile
$0.09
|
Avg MPG
20.7
|
2017
|
Total Fuel-ups
75
|
Avg Miles/Fuel-Up
281.2
|
Avg Price/Gallons
$2.12
|
|
Total Miles Tracked
20,249
|
Total Gallons Fueled
990.46
|
Avg Price/Fuel-up
$29.13
|
|
Total Spent
$2,184.39
|
Avg Price/Mile
$0.10
|
Avg MPG
20.4
|
2018
|
Total Fuel-ups
47
|
Avg Miles/Fuel-Up
301.5
|
Avg Price/Gallons
$2.38
|
|
Total Miles Tracked
13,568
|
Total Gallons Fueled
693.98
|
Avg Price/Fuel-up
$36.81
|
|
Total Spent
$1,730.07
|
Avg Price/Mile
$0.12
|
Avg MPG
19.6
|
2019
|
Total Fuel-ups
51
|
Avg Miles/Fuel-Up
315.7
|
Avg Price/Gallons
$2.18
|
|
Total Miles Tracked
15,154
|
Total Gallons Fueled
754.11
|
Avg Price/Fuel-up
$34.23
|
|
Total Spent
$1,745.55
|
Avg Price/Mile
$0.11
|
Avg MPG
20.1
|
2020
|
Total Fuel-ups
23
|
Avg Miles/Fuel-Up
264.7
|
Avg Price/Gallons
$1.93
|
|
Total Miles Tracked
3,970
|
Total Gallons Fueled
241.71
|
Avg Price/Fuel-up
$30.44
|
|
Total Spent
$700.06
|
Avg Price/Mile
$0.12
|
Avg MPG
16.4
|
2021
|
Total Fuel-ups
1
|
Avg Miles/Fuel-Up
N/A
|
Avg Price/Gallons
$2.86
|
|
Total Miles Tracked
0
|
Total Gallons Fueled
N/A
|
Avg Price/Fuel-up
$48.15
|
|
Total Spent
$48.15
|
Avg Price/Mile
N/A
|
Avg MPG
N/A
|