Lightning Blue
2012 Mini Cooper. Property of mdsbrain. Added Nov 7 2011
2011
|
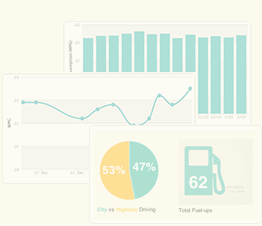
Total Fuel-ups
9
|
Avg Miles/Fuel-Up
285.7
|
Avg Price/Gallons
$3.41
|
|
Total Miles Tracked
2,572
|
Total Gallons Fueled
98.92
|
Avg Price/Fuel-up
$37.52
|
|
Total Spent
$337.65
|
Avg Price/Mile
$0.13
|
Avg MPG
26.0
|
2012
|
Total Fuel-ups
55
|
Avg Miles/Fuel-Up
301.8
|
Avg Price/Gallons
$3.69
|
|
Total Miles Tracked
16,597
|
Total Gallons Fueled
585.48
|
Avg Price/Fuel-up
$39.19
|
|
Total Spent
$2,155.38
|
Avg Price/Mile
$0.13
|
Avg MPG
28.3
|
2013
|
Total Fuel-ups
54
|
Avg Miles/Fuel-Up
323.3
|
Avg Price/Gallons
$3.70
|
|
Total Miles Tracked
17,456
|
Total Gallons Fueled
585.62
|
Avg Price/Fuel-up
$40.17
|
|
Total Spent
$2,168.97
|
Avg Price/Mile
$0.12
|
Avg MPG
29.8
|
2014
|
Total Fuel-ups
54
|
Avg Miles/Fuel-Up
296.6
|
Avg Price/Gallons
$3.51
|
|
Total Miles Tracked
16,015
|
Total Gallons Fueled
548.73
|
Avg Price/Fuel-up
$35.47
|
|
Total Spent
$1,915.34
|
Avg Price/Mile
$0.12
|
Avg MPG
29.2
|
2015
|
Total Fuel-ups
50
|
Avg Miles/Fuel-Up
288.4
|
Avg Price/Gallons
$2.74
|
|
Total Miles Tracked
14,418
|
Total Gallons Fueled
488.37
|
Avg Price/Fuel-up
$26.68
|
|
Total Spent
$1,334.09
|
Avg Price/Mile
$0.09
|
Avg MPG
29.5
|
2016
|
Total Fuel-ups
46
|
Avg Miles/Fuel-Up
329.5
|
Avg Price/Gallons
$2.57
|
|
Total Miles Tracked
15,157
|
Total Gallons Fueled
509.56
|
Avg Price/Fuel-up
$28.75
|
|
Total Spent
$1,322.49
|
Avg Price/Mile
$0.09
|
Avg MPG
29.7
|
2017
|
Total Fuel-ups
41
|
Avg Miles/Fuel-Up
287.4
|
Avg Price/Gallons
$2.78
|
|
Total Miles Tracked
11,783
|
Total Gallons Fueled
398.57
|
Avg Price/Fuel-up
$26.98
|
|
Total Spent
$1,106.33
|
Avg Price/Mile
$0.09
|
Avg MPG
29.6
|
2018
|
Total Fuel-ups
27
|
Avg Miles/Fuel-Up
281.5
|
Avg Price/Gallons
$2.98
|
|
Total Miles Tracked
7,599
|
Total Gallons Fueled
275.24
|
Avg Price/Fuel-up
$30.53
|
|
Total Spent
$824.35
|
Avg Price/Mile
$0.11
|
Avg MPG
27.6
|
2019
|
Total Fuel-ups
3
|
Avg Miles/Fuel-Up
316.1
|
Avg Price/Gallons
$2.70
|
|
Total Miles Tracked
948
|
Total Gallons Fueled
35.59
|
Avg Price/Fuel-up
$31.96
|
|
Total Spent
$95.87
|
Avg Price/Mile
$0.10
|
Avg MPG
26.6
|
2020
|
Total Fuel-ups
1
|
Avg Miles/Fuel-Up
326.8
|
Avg Price/Gallons
$1.94
|
|
Total Miles Tracked
327
|
Total Gallons Fueled
11.36
|
Avg Price/Fuel-up
$22.02
|
|
Total Spent
$22.02
|
Avg Price/Mile
$0.07
|
Avg MPG
28.8
|
2021
|
Total Fuel-ups
5
|
Avg Miles/Fuel-Up
349.6
|
Avg Price/Gallons
$3.31
|
|
Total Miles Tracked
1,748
|
Total Gallons Fueled
53.22
|
Avg Price/Fuel-up
$34.39
|
|
Total Spent
$171.96
|
Avg Price/Mile
$0.10
|
Avg MPG
32.8
|
2022
|
Total Fuel-ups
3
|
Avg Miles/Fuel-Up
330.9
|
Avg Price/Gallons
$3.75
|
|
Total Miles Tracked
993
|
Total Gallons Fueled
33.35
|
Avg Price/Fuel-up
$41.45
|
|
Total Spent
$124.35
|
Avg Price/Mile
$0.13
|
Avg MPG
29.8
|
2023
|
Total Fuel-ups
3
|
Avg Miles/Fuel-Up
290.0
|
Avg Price/Gallons
$4.07
|
|
Total Miles Tracked
870
|
Total Gallons Fueled
37.38
|
Avg Price/Fuel-up
$51.03
|
|
Total Spent
$153.08
|
Avg Price/Mile
$0.18
|
Avg MPG
23.3
|
2024
|
Total Fuel-ups
2
|
Avg Miles/Fuel-Up
165.5
|
Avg Price/Gallons
$3.91
|
|
Total Miles Tracked
331
|
Total Gallons Fueled
14.43
|
Avg Price/Fuel-up
$28.16
|
|
Total Spent
$56.32
|
Avg Price/Mile
$0.17
|
Avg MPG
22.9
|